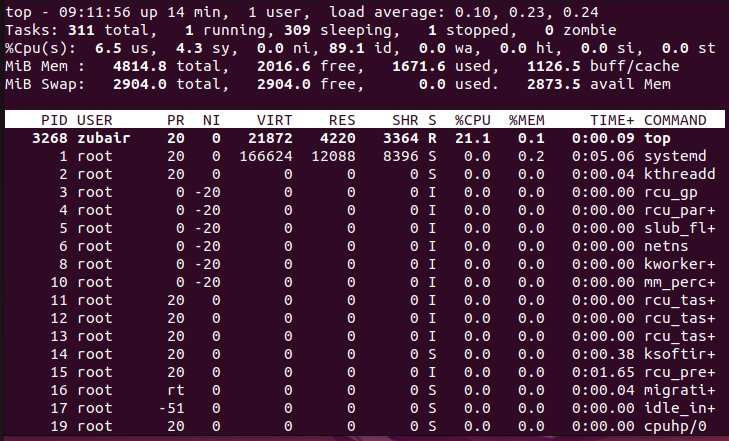
In the Linux operating system, understanding how resources like CPU and memory are utilized is crucial for system optimization and troubleshooting. The top command is a highly effective tool for fulfilling this objective. It displays real-time information about the system’s running processes and resource usage.
However, this is not the only thing you get out of it, but a whole lot of information about your system. But the thing is that you understand how to use this command effectively and how you read the results; that’s what matters the most. So, let’s get into it directly and see what it holds for us.
What is the top Command?
On Linux systems, both system administrators and regular users commonly rely on the top command. Essentially, it’s a real-time monitoring tool that provides a dynamic, live view of the processes running on a system.
When you run the top command in your terminal, it pulls up a dashboard with a plethora of information. This information includes a list of all the running processes, along with details such as their Process IDs (PIDs), the user running them, CPU usage, memory usage, and more.
Furthermore, it allows you to perform actions and control the processes directly from the interface. For instance, you can terminate processes, change their priorities, and even control the refresh rate of the information displayed.
Turns out, it is essential for system monitoring and managing processes, especially when you need to make real-time decisions.
Installing top Command on Linux
Generally, the top command comes pre-installed with most Linux distributions. However, in case it’s not available, or if you’re using a minimal installation, here’s how you can install it:
1: Update Package List:
Before installing any new software, it’s a good practice to update the package list so that you get the latest version. Open your terminal and type the following command:

This command updates the list of packages and their versions but doesn’t install or upgrade any.
2: Install the top Command:
Now that your package list is up-to-date let’s install the top command. Type the following command in the terminal and hit Enter:

Remember, if you are not using a Debian-based system (like Ubuntu), the package manager might be different. For Red Hat-based distributions (like Fedora and CentOS), use:
Here, procps is a package that contains the top command along with some other process monitoring tools.
3: Verify the Installation:
Once the installation is complete, it’s good to verify that the top command has been successfully installed. Type top in your terminal and press Enter. If you see a screen with a list of processes and their resource usage, congratulations! You’ve successfully installed the top command.

4: Learn from the manual
Having installed the top command, it’s beneficial to understand its fundamental operation. Type man top in your terminal to access the manual page, which provides detailed information on how to use the top command.
Using the top Command
Now that you have the top command installed let’s dive into how to actually use it.
1: Running top Command
Starting the top command is easy. Open your terminal and simply type top, then press Enter. You will witness an up-to-the-minute presentation of active processes and the extent to which they utilize CPU and memory resources. To sort processes by CPU usage, just press the ‘P’ key.
2: Reading the Output
Now, let’s analyze and examine what you are observing.. At the uppermost section, you will see a concise overview of your system’s current state. It shows you:
- How long your system has been running (uptime)
- How many users are logged in
- The load average (a measure of system activity)
- How many tasks are running or sleeping
- CPU usage
- Memory usage
In the following section, you will find a roster of active processes. Each line represents a single process. Here’s what the columns mean:
- PID: The process ID – a unique number for each process.
- USER: Who started the process – usually your username or the system.
- PR: Priority of the process.
- VIRT: Virtual memory used by the process.
- RES: Physical memory used by the process.
- SHR: Shared memory used by the process.
- S: Process status, like sleeping (S) or running (R).
- %CPU: How much of the CPU the process is using.
- %MEM: How much memory the process is using.
- TIME+: How much CPU time the process has consumed.
- COMMAND: The command’s name that initiated this process..
3: Killing a Process
Sometimes a process goes rogue, and you need to shut it down. To do this, press the ‘k‘ key, input the PID of the desired process to terminate, and subsequently press Enter.. Be careful with this – you don’t want to shut down something important by mistake!
4: Changing the Priority of a Process
Maybe you don’t need to shut a process down, but you want it to use less CPU. You can change its priority by pressing ‘r,’ entering the PID, and then setting the new nice value (between -20 and 19, where -20 is the highest priority).
5: Exiting top Command
Done monitoring? To exit the top command, just press ‘q’ or ‘Ctrl+C.’
Conclusion
The top command is essential for overseeing and administering processes on your system. It enables you to access real-time information regarding your system’s CPU usage, memory utilization, and other available resources. The top command is particularly helpful for system administrators and developers who need to ensure optimal performance.


