The matplotlib.pyplot module’s plot() method offers a single interface for constructing many sorts of graphs. This function accepts any two arguments, in our case, x and y, and generates a visual representation of the relevant points in x and y. Following these procedures, we may plot a function:
- First of all, we import the pyplot function from the matplotlib module.
- Then we define values for the x and y variables, which are dependent on the type of function to be plotted.
- Then we use the plt.plot() function to draw the figure.
- Lastly, we use the plt.show() function to display the plot.
Let’s consider the following examples for plotting functions.
Example 1: Identity function
From matplotlib, import pyplot as plt.

x = [0, 1, 2, 3, 4, 5]

y=x

plt.plot(x, y)

plt.show()
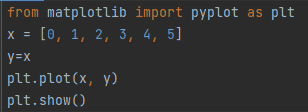
Figure 1: Identity Function
Output:
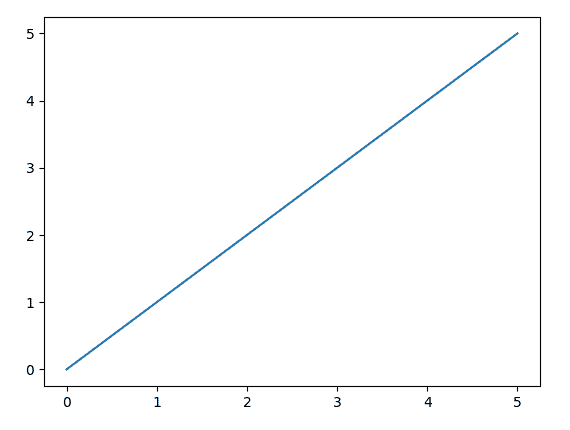
In an identical function, values of x and y are the same, so we get a straight line plot as shown in figure 2.
Example 2: Sine function
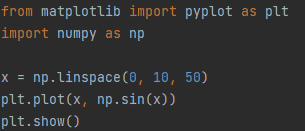
from matplotlib import pyplot as plt

import numpy as np

x = np.linspace(0, 10, 50)

plt.plot(x, np.sin(x))

plt.show()
Output:

In example 2, we are using the NumPy module. As x is generated using the np.linespace function, which returns evenly spaced numbers between 0 and 1 over a specified interval. Here, y is also the sine function of the NumPy module. The plot for the sine function is shown in figure 4.
Example 3: Quadratic function
from matplotlib import pyplot as plt

import numpy as np

x =np.array([1, 2, 3, 4, 5, 6, 7, 8, 9, 10])

a = 3

b = 8

c = 9

y = a * (x ** 2) + b * x + c

print('Values of x: ', x)

print('Values of y: ', y)

plt.plot(x, y)

plt.title("Quadratic Function")

plt.xlabel("Values of x")

plt.ylabel("Values of y")

plt.show()
Output:
![]()
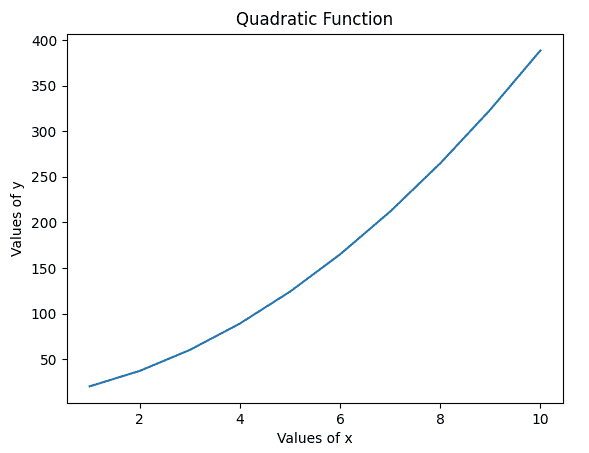
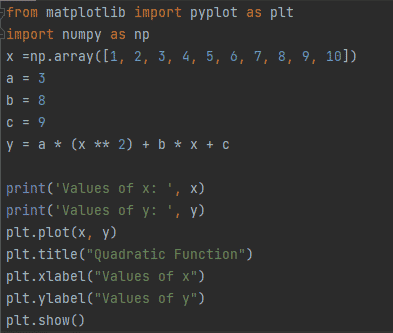
In example 3, we have an x variable list which is converted to a matrix using the array function of the numpy module. The value of y is calculated by inserting values of variables and constants into a quadratic equation. The output of the quadratic function is shown in figure 6. A plot is drawn for quadratic function as shown in figure 7.
Example 4: Cubic Function
from matplotlib import pyplot as plt

import numpy as np

x =np.array([-4, -3, -2, -1, 0, 1, 2, 3, 4])

a = 2

b = 4

c = 6

d = 8

y = a * (x ** 3) + b * (x ** 2) + c * x + d

print('Values of x: ', x)

print('Values of y: ', y)

plt.plot(x, y)

plt.xlabel("Values of x")

plt.ylabel("Values of y")

plt.title("Cubic Function")

plt.show()

Output:
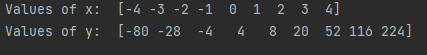
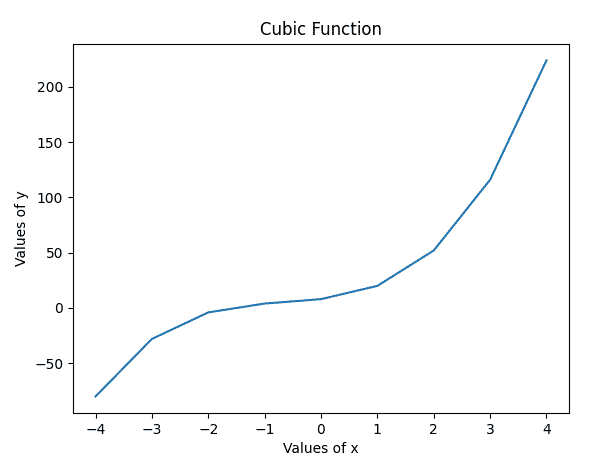
In example 4, y represents the cubic equation. Values for cubic functions are calculated and displayed in figure 9. A cubic function plot is drawn in figure 10.

Karim Buzdar holds a degree in telecommunication engineering and holds several sysadmin certifications including CCNA RS, SCP, and ACE. As an IT engineer and technical author, he writes for various websites.