Strace is a very powerful debugging command-line utility tool which helps to troubleshoot the issues by monitoring the system calls and signals of the specific program. In case we do not have source code available, strace can be used to analyze how a program interacts with the system. In this article, we will discuss some important strace commands to troubleshoot and debug programs and processes in Linux.
Installation
Installation of strace utility tools is a straightforward and easy process. Use the following command to install the application as per your Linux distribution.
Debian/Ubuntu
$ sudo apt install strace
RedHat/CentOS
$ yum install strace
Verify the installation by running the following command
$ strace -V
Output:

1.Trace Linux Command system calls using strace
Strace is helpful while tracing Linux command system calls. In this example, a simple command pwd is used for tracing.
$ strace pwd
Output:

2. Redirect trace log in a file
The system calls trace log can be redirected to a file using strace command as:
$ strace -o pwd-log.txt pwd
Use cat command to find the contents of the file as:
$ cat pwd-log.txt
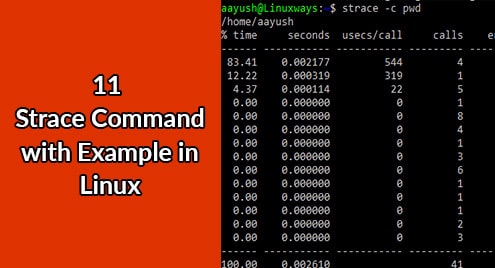
3. Use strace to print system calls summary instead of regular output.
Using strace with option -c makes it possible to print the log summary. In this example, a summary of the linux command pwd is presented.
$ strace -c pwd
Output:

4. Trace particular system calls using strace
Strace command with option -e and trace type (read, write) can be used to trace specific system calls. In this example, the write system call is being traced for the command pwd.
$ strace -e trace=write pwd
Output:

5. Strace command to print timestamp of each system call.
Strace command with the option -r can be used to print all the relative timestamps of each system call.
$ strace -r pwd
Output:

6. Tracing using process id
If there is any process already running in the system, the system calls can be traced by using strace command with option -p along with the process id. In this example, the process id of nginx is used for tracing
Syntax
$ strace -p <process id>
$ strace -p 12842

Tracing can be stopped by pressing ctrl+c.
7. Strace command to print debugging output
Strace command with option -d can be used to print debugging output. In this example, a simple Linux command pwd is used for tracing.
$ strace -d pwd
Output:

8. Strace command to print time spent on system calls.
Strace command with option -T gives the time spent on system calls as:
$ strace -T pwd
Output:

9. Strace command to print instruction pointer
Strace command with the option -i prints the instruction pointer. In this example, a simple Linux command pwd is used for tracing.
$ strace -i pwd
Output:

10. Strace command to trace system calls based on specific condition
Strace command can be used to trace system calls based on specific conditions such as memory, process, CPU, etc. In this example, system calls related to memory management are being traced for a simple Linux command pwd.
$ strace -q -e memory pwd
Output:

11. Strace command to trace signal related system calls
Signal-related system calls can be traced by defining the trace type in the command. In this example nc -v -n localhost 80 is used for tracing system calls related to the signal.
$ strace -e trace=signal nc -v -n 127.0.0.1 80
Output:

Conclusion
In this article, we learned what is strace utility tool and when It can be used. Also, I have covered some important strace commands to troubleshoot and debug system calls and processes.

Karim Buzdar holds a degree in telecommunication engineering and holds several sysadmin certifications including CCNA RS, SCP, and ACE. As an IT engineer and technical author, he writes for various websites.