Netstat stands for Network statistics. This is a command-line tool used to show intensive deep information about how your system is communicating with other network devices or remote machines. Netstat command specifically displays the details of all individual network connections, protocol-oriented and overall statistics of the computer network. Using the netstat utility, you can easily troubleshoot your network problems. Netstat utility is a cross-platform command-line tool that is available for almost all Windows versions, Linux OS, and Mac operating systems.
This article will provide the complete details about the usage of the netstat command. You will also learn how users can monitor network traffic using the netstat command-line utility.
Installation of Netstat command-line tool
To use the netstat utility, you need to install net-tools on your Linux system using the following command:
For Ubuntu / Debian operating distribution
$ sudo apt install net-tools
For CentOS 8 and Fedora distribution
$ sudo dnf install net-tools
How to use the Netstat command to monitor network traffic?
The following syntax generally is used to run the netstat command:
Netstat {options}
Now, explain the working of each option with the help of some examples:
List all connections and ports
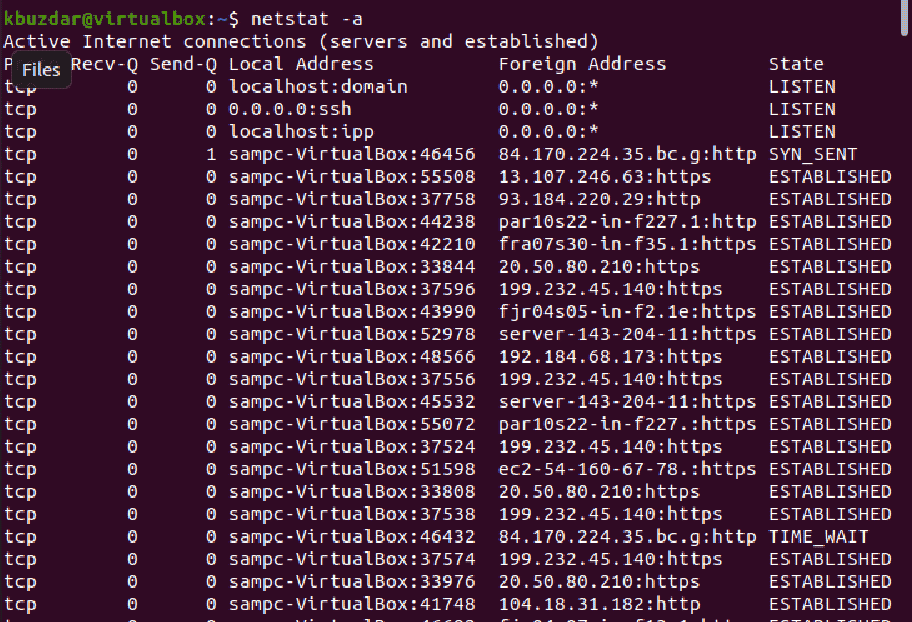
To display the report of all active, established, and listening TCP, UDP connections use the following netstat command along with the option -i.
$ netstat –i
List all TCP / UDP Ports only
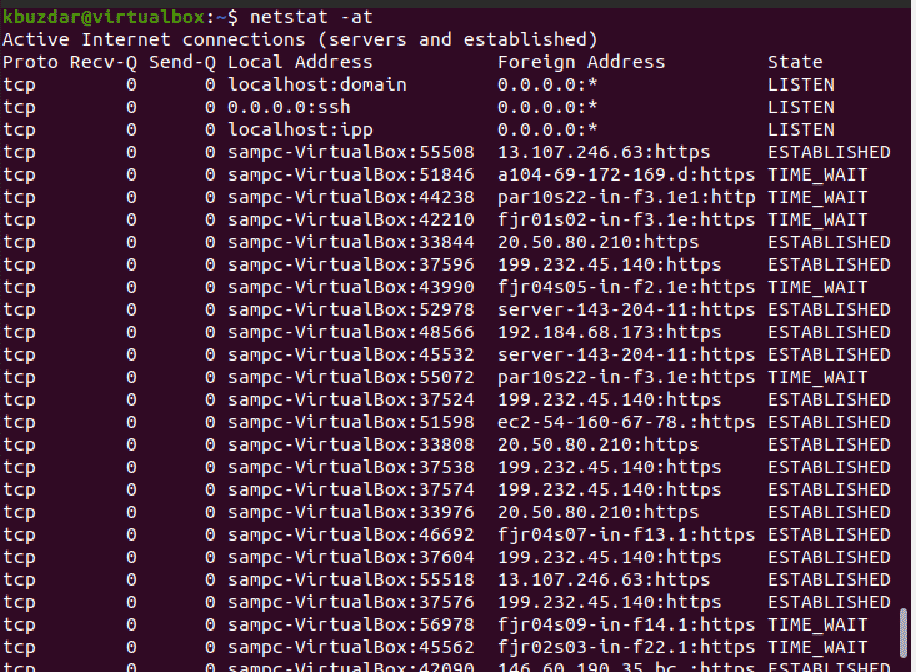
To list all TCP ports run the below-mentioned command:
$ netstat -at
Similarly, to list only all UDP ports, use the following command:
$ netstat -au

List all TCP / UDP / UNIX listening ports
Use the following command to display all listening TCP ports:
$ netstat -lt

To display all listening UDP ports, run the following command:
$ netstat -lu
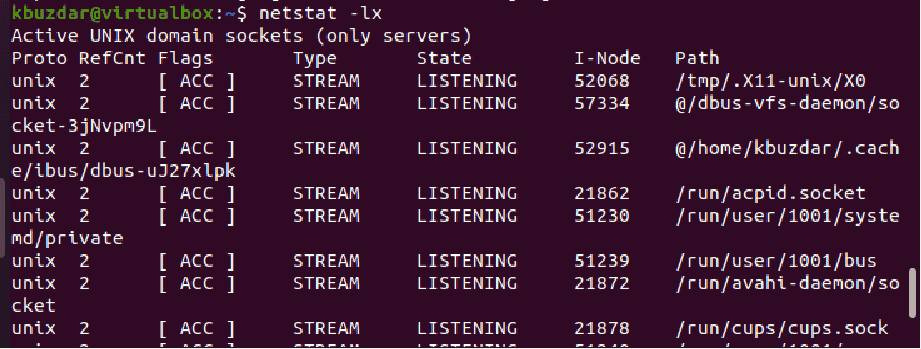
To list all UNIX listening ports use the command as follows:
$ netstat -lx
List statistics of all TCP / UDP ports
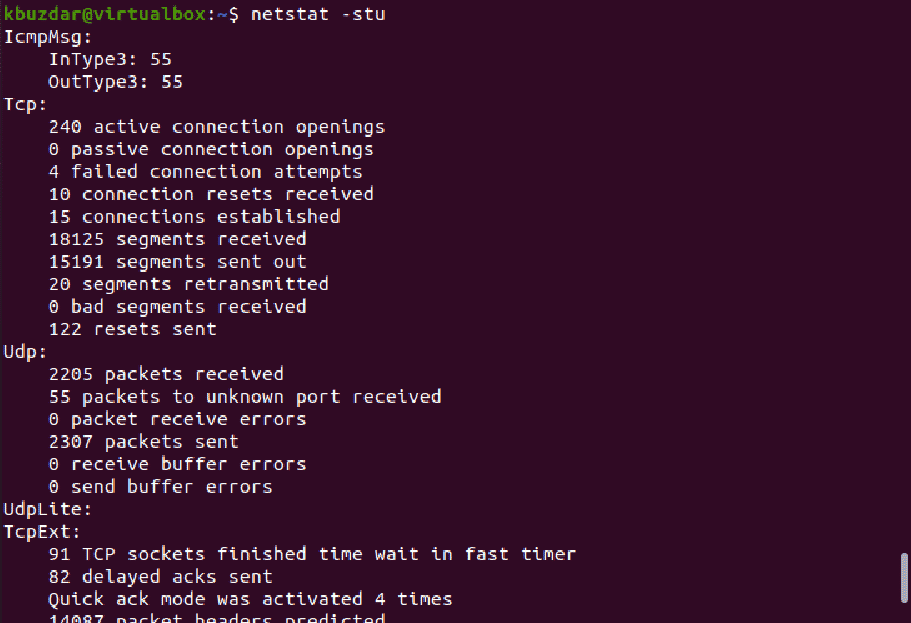
The ‘-s’ option is to specifically print the statistics of your overall network. However, you can specifically display the statistics of TCP and UDP ports by using the following command:
$ netstat -stu
List network interfaces transactions
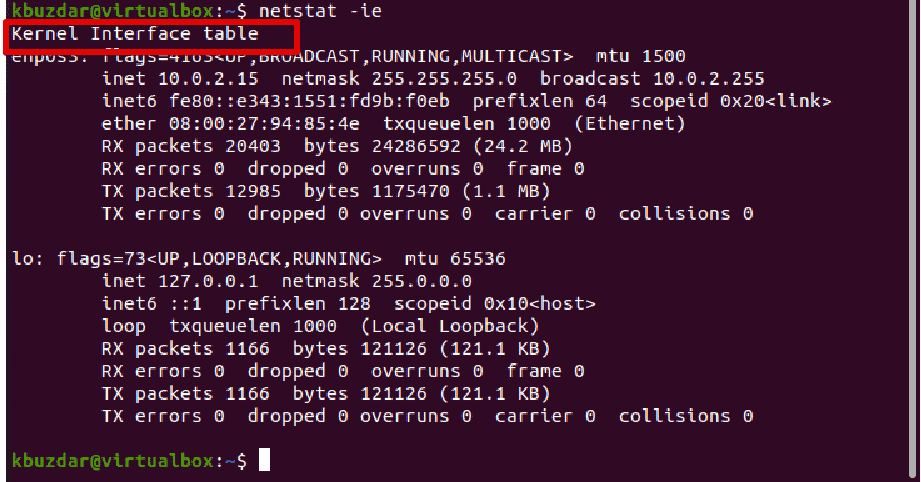
To list all MTU transferring and receiving packets information in the kernel interface table, use the below-mentioned command:
$ netstat –i

To display a more extended kernel interface table information use the command which is given below:
$ netstat -ie
List summary of listening processes
By combining different netstat options, you can do a more advanced search about listening connections as follows:
$ sudo netstat –tulpen
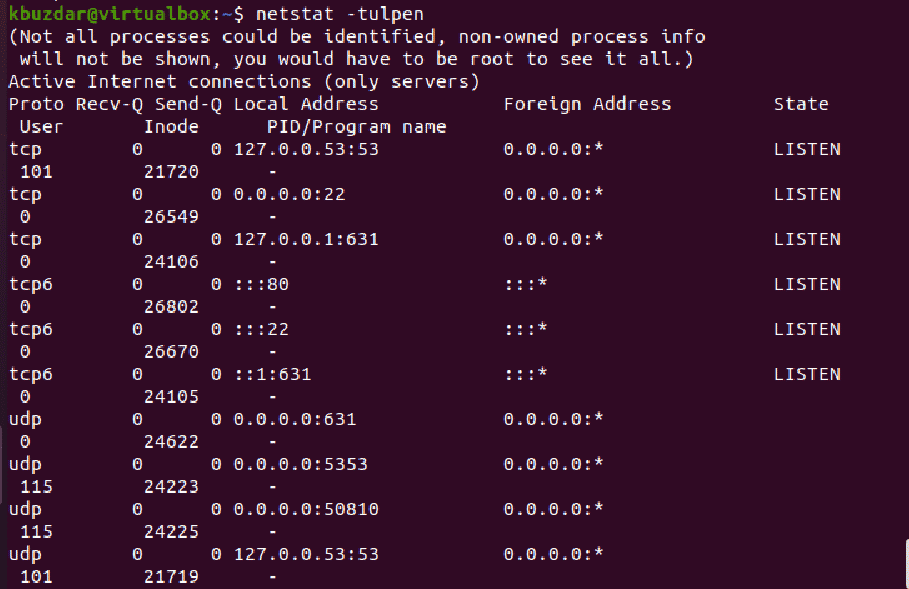
t – Shows TCP connections
u – Shows UDP connections
l – Displays all listening connections
p – Shows the program name to which the listed connection belongs
e – Displays the extended information
n – Displays the users, addresses, and ports numerically.
Similarly, if you want to display all sockets instead of display only the listening sockets replace the ‘-l’ option with ‘-l’ in the above-mentioned command:
$ netstat -atupen
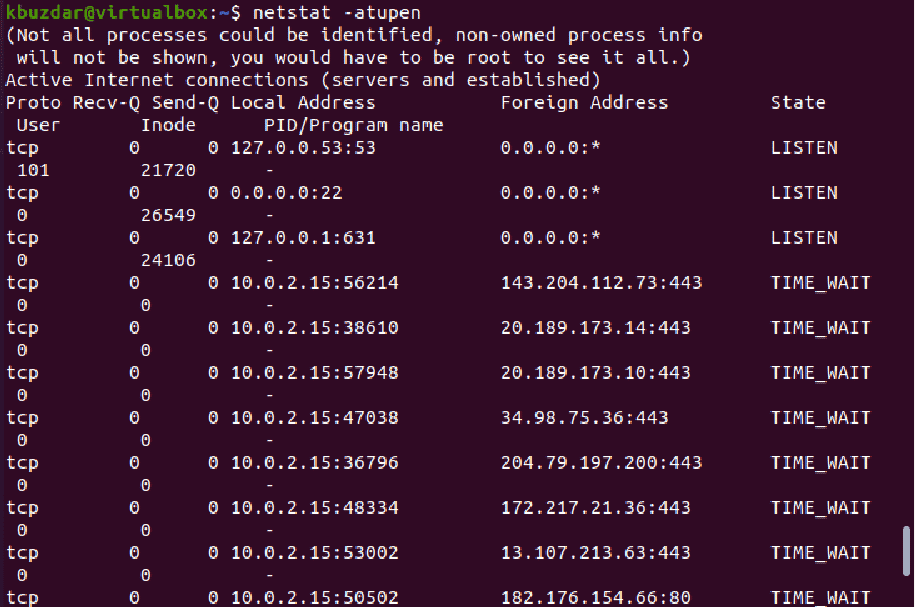
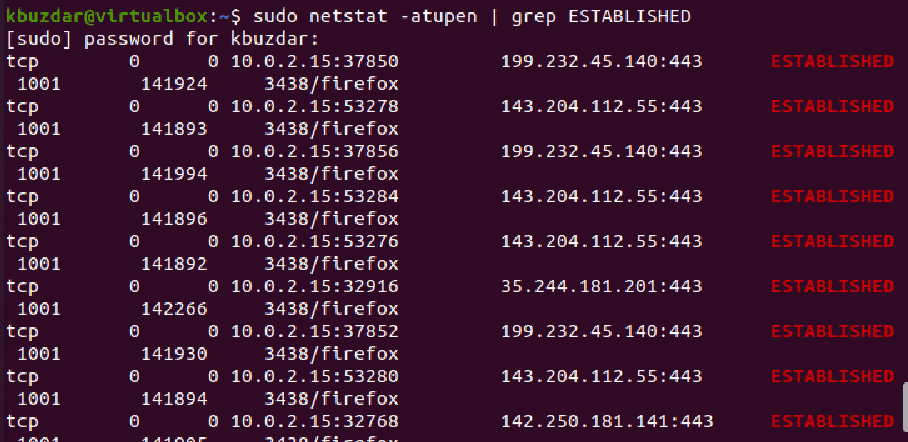
To only list the established connections from the above output, you can use the grep command for piping the output as follows:
$ sudo netstat -atupen | grep ESTABLISHED
Display network details continuously
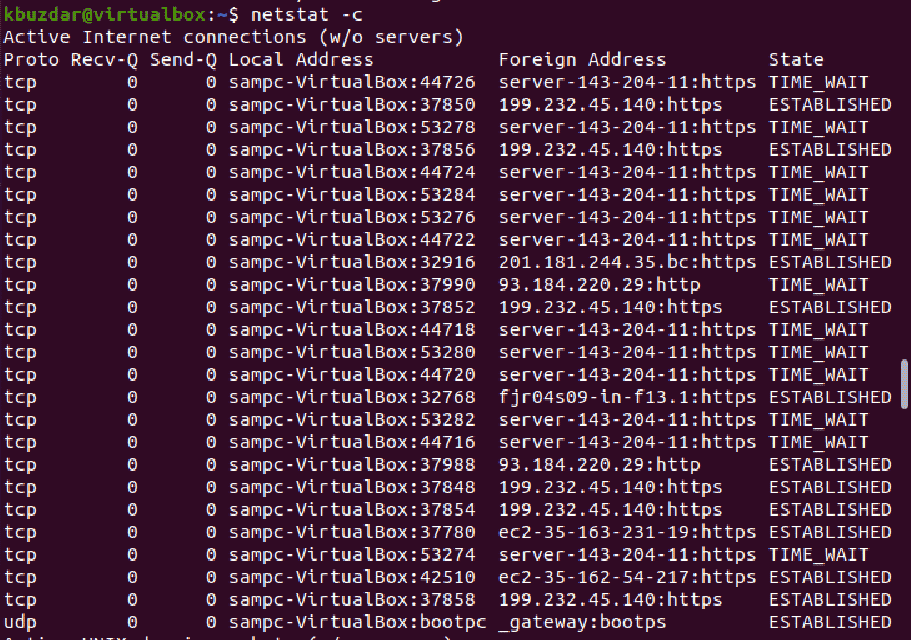
To display the network information continuously after each second, use the below-mentioned command:
$ netstat -c
To print all listening TCP connections continuously, use the command, which is given below:
$ netstat -clt
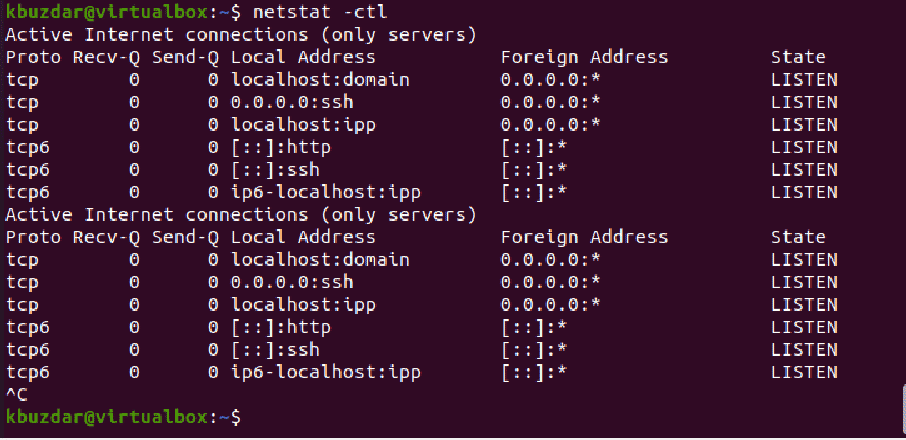
Using ‘Ctrl+c’ to exit from continues output display.
To view all unconfigured addresses, use the following command:
$ netstat --verbose

You can also list a process that uses the specific port for example list programs using port 80.
$ netstat -an | grep ':80'

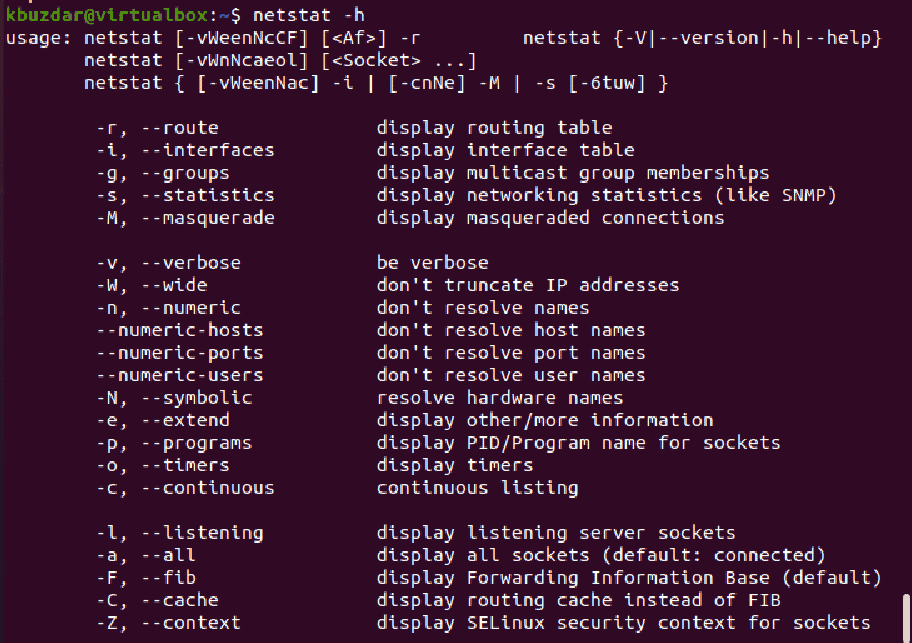
To get more help related to netstat options and their usage, use the following command:
$ netstat -h
Conclusion
We have seen how to monitor network traffic using the netstat command. We explored the uses of the netstat command on the Linux system. In this article, we learned different netstat options that provide help to find the desired results.
