Sysstat is a robust logging and performance monitoring utility for Linux/Unix systems. It can be used to keep track of system performance and usage activity.
Systat saves the statistics collected in a file that can be exported into various formats such as JSON, CSV, etc. Though many Linux distributions include GUI-based monitoring apps, sysstat is especially useful in a server setting.
This guide will show you how to use the systat tool to collect key system information on Linux.
Install Systat tool
Systool is available in the default repositories of various Linux distros. To install on Debian-based systems , use the command:
$ sudo apt install systool
To install on Red-Hat based distros, run the command:
$ sudo yum install systool
Common usage of Sysstat
The sysstat suite comprises various tools that help collect information on CPU and I/O statistics. This guide will discuss how to use the tools to get system information. These tools include:
- iostat – shows an overview of CPU and I/O statistics for drives and partitions
- mpstat– displays processor statistics.
- pidstat – gives an overview of I/O, memory statistics for processes.
- sar – used for collecting and saving all the system activities and reports.
- sadc- collects system usage activity and writes it to a file.
Check CPU usage
Sars is used to collect system statistics such as CPU utilization, memory among others. View your CPU utilization statistics for the day as shown. Sar monitors data every 10 minutes by default.
$ sar -u

To display real-time CPU utilization for a set period of time, specify the intervals in seconds followed by the number of entries to report. For instance, to view total CPU utilization every 3 seconds for a total of 15 times run:
$ sar -u 3 15
Check individual CPU usage
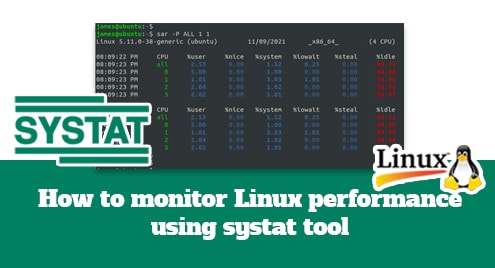
Currently, the majority of PCs have several cores. To display the statistics of each core use the sars command followed by the “-P ALL” parameter as shown below:
$ sar -P ALL 1 1
The screen below shows the system’s four cores with the same time interval and output parameters applied.

Check memory usage
To display the amount of memory in use at a particular time use the -r option.
$ sar -r

Display device report
Use the iostat command to display a device report showing current data transfer per second (tps), average block rate, and data read and write statistics. Run the following command:
$ iostat -d

The columns in the output above represent:
- tps – transfers per second issued on the device
- kB_read/s – shows the amount of kilobytes read in blocks per second
- kB_wrtn/s – the amount of data written to devices in kbs per second
- kB_read – total kilobytes read
- kB_wrtn – total number of kilobytes written
To view extended I/O statistics run:
$ iostat -x

View current processes
The pidstat command is used to keep track of each individual task managed by the kernel. To get information about the running processes, run the pidstat command followed by -d parameter as shown.
$ pidstat -d

You can also pidstat with the -r option to analyze memory usage with particular processes:
$ pidstat -r

Conclusion
Sysstat is a powerful monitoring tool for Linux environments. For further information on Systat, check out the Sysstat Documentation.