Prometheus is a system monitoring tool used for recording real-time metrics and system performance in a time-series database. It is open-source software that was originally developed at SoundCloud using the Go programming language.
You can monitor applications and system resources such as CPU usage, memory utilization, network bandwidth among others.
Prometheus can be accessed through a web interface, therefore, allowing you to monitor your server from any device. Moreover, you can send alerts via email and SMS messages in case a problem is identified in your system.
In this guide, we’ll discuss how you can install Prometheus on Ubuntu 20.04.
Step 1: Create system Users and Directory
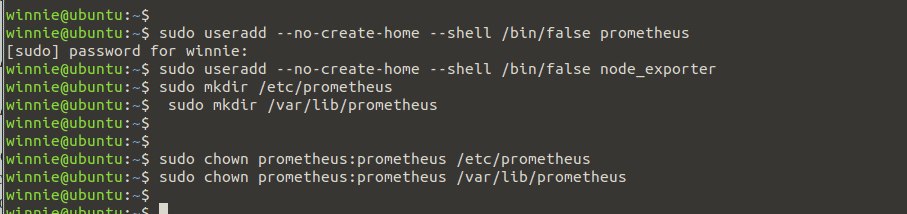
First, you need to create a system user and group for Prometheus. Let’ create a user, group, and directory called Prometheus. Run the following commands:
$ sudo useradd --no-create-home --shell /bin/false prometheus
$ sudo useradd --no-create-home --shell /bin/false node_exporter
Thereafter, we need to create directories for storing Prometheus files and data. Create a /var/lib directory for its data and /etc directory for configuration files.
$ sudo mkdir /etc/prometheus

$ sudo mkdir /var/lib/prometheus
Next, modify the user and group ownership on the new directories to the Prometheus user you created. Run:
$ sudo chown prometheus:prometheus /etc/prometheus

$ sudo chown prometheus:prometheus /var/lib/prometheus
Step 2: Download Prometheus
Next, download the latest Prometheus archive file from Github or Prometheus official page. Execute the following wget command:
$ wget https://github.com/prometheus/prometheus/releases/download/v2.21.0/prometheus-2.31.0.linux-amd64.tar.gz
Then, use the sha256sum command line to verify the integrity of the Prometheus archive file you just downloaded.
$ sha256sum prometheus-2.31.0.linux-amd64.tar.gz
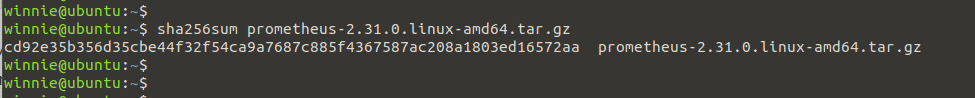
Ensure that the result of the above command matches the SHA256 Checksum on the official Prometheus download page. It will guarantee that our file is authentic and not corrupted.
Next, extract the contents of the archive file.
$ tar -xvf prometheus-2.21.0.linux-amd64.tar.gz
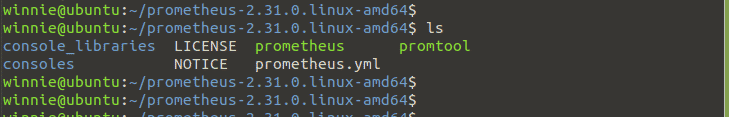
Navigate into the prometheus folder as shown:
$ cd prometheus-2.21.0.linux-amd64
Use the ls command to view the contents of the folder. You see two binary files (Prometheus and promtool), one prometheus.yml, two consoles, and console libraries directories containing the web interface files.
Step 3: Copy Prometheus Binary files
As seen, the prometheus directory contains two binary files, Prometheus and promtool. Copy the binary files to /usr/local/bin directory as shown:
$ sudo cp prometheus-2.31.0.linux-amd64/prometheus /usr/local/bin/

$ sudo cp prometheus-2.31.0.linux-amd64/promtool /usr/local/bin/
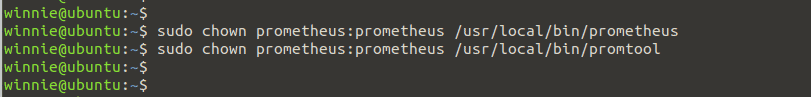
Next, set the user and group ownership on the binary files. Execute the commands:
$ sudo chown prometheus:prometheus /usr/local/bin/prometheus

$ sudo chown prometheus:prometheus /usr/local/bin/promtool
Step 4: Copy Prometheus Console Libraries
We also need to copy prometheus console and console_libraries directories to /etc/prometheus/. Run:
$ sudo cp -r prometheus-2.31.0.linux-amd64/consoles /etc/prometheus

sudo cp -r prometheus-2.31.0.linux-amd64/console_libraries /etc/prometheus

$ sudo cp -r prometheus-2.31.0.linux-amd64/prometheus.yml /etc/prometheus
Then, update the user and group ownership on the /etc/promotheus directory using the command below:
$ sudo chown -R prometheus:prometheus /etc/prometheus/consoles

$ sudo chown -R prometheus:prometheus /etc/prometheus/console_libraries

$ sudo chown -R prometheus:prometheus /etc/prometheus/prometheus.yml
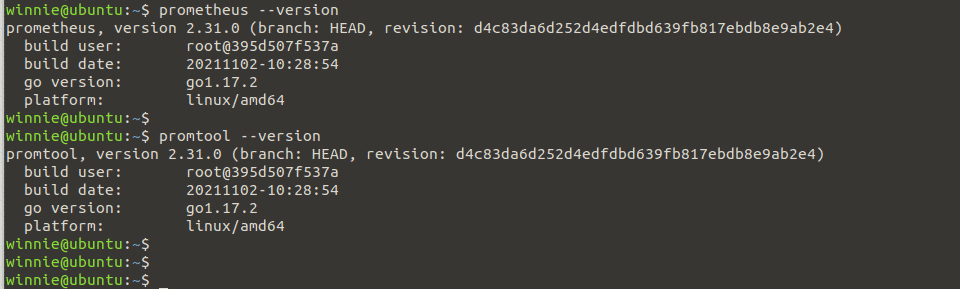
Prometheus has now been successfully installed on our system. Confirm the version installed with the command:
$ prometheus --version

$ promtool --version
Step 5: Configure prometheus
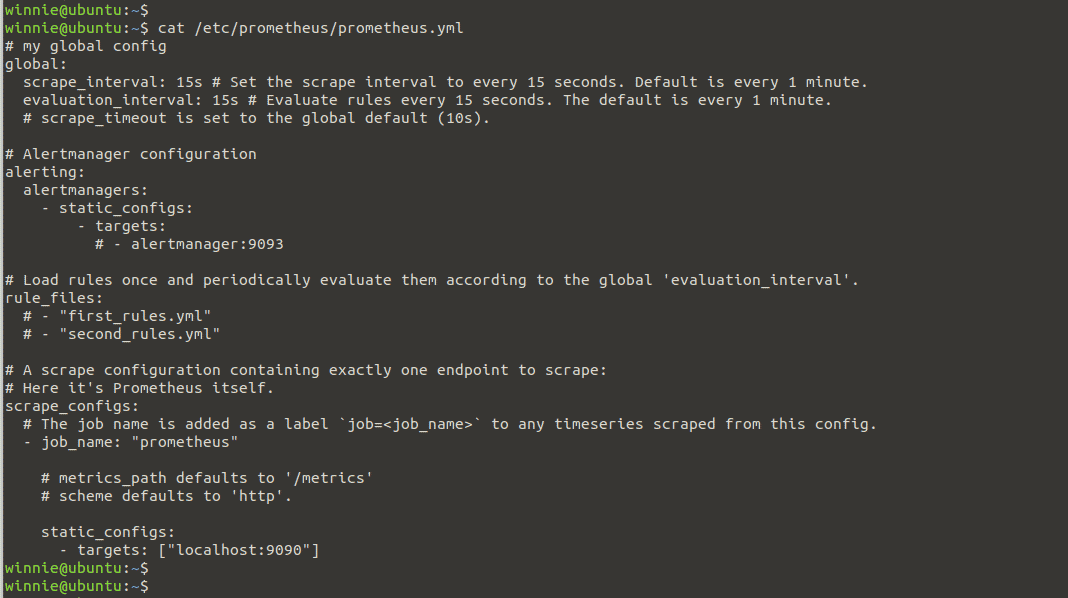
Next, open the prometheus default configuration file as shown below. You can modify the settings according to your preferences
$ cat /etc/prometheus/prometheus.yml
Step 6: Create Prometheus Systemd file
To launch Prometheus as a service, we must first configure it. We will specify a location for both the configuration file and the data directory as shown:
$ sudo -u prometheus /usr/local/bin/prometheus \

 --config.file /etc/prometheus/prometheus.yml \

 --storage.tsdb.path /var/lib/prometheus/ \

 --web.console.templates=/etc/prometheus/consoles \

 --web.console.libraries=/etc/prometheus/console_libraries
Next, create a systemd file for Prometheus so that you can easily manage the service. Let’s create a systemd file in /etc/systemd/system directory as shown:
$ sudo nano /etc/systemd/system/prometheus.service
Next, copy the lines below to the systemd file.
[Unit]

Description=Prometheus

Wants=network-online.target

After=network-online.target

[Service]

User=prometheus

Group=prometheus

Type=simple

ExecStart=/usr/local/bin/prometheus \

 --config.file /etc/prometheus/prometheus.yml \

 --storage.tsdb.path /var/lib/prometheus/ \

 --web.console.templates=/etc/prometheus/consoles \

 --web.console.libraries=/etc/prometheus/console_libraries

[Install]

WantedBy=multi-user.target
Save and close the file.
Next, reload the daemon services for the changes to be applied. Run:
$ sudo systemctl daemon-reload
Then, start and enable Prometheus service with the following commands:
$ sudo systemctl start prometheus

$ sudo systemctl enable prometheus
Now check the status of Prometheus with the command:
$ sudo systemctl status prometheus
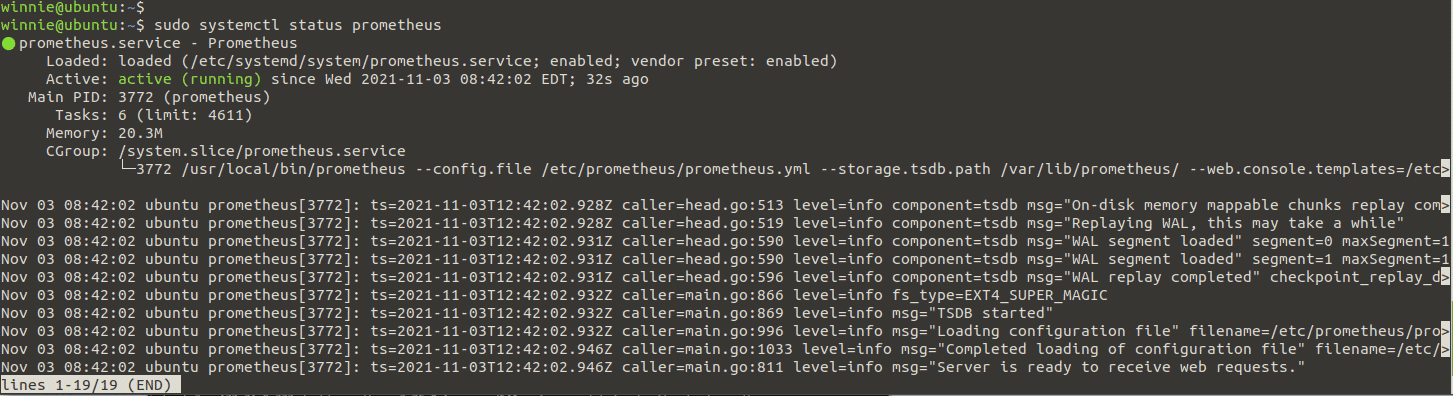
Prometheus is now up and running.
Step 7: Accessing Prometheus
Now that Prometheus has been configured successfully, we can access it through the web interface. Also, make sure that port 9090 is enabled in the firewall. To allow the prometheus service in the firewall, run:
$ sudo ufw allow 9090/tcp
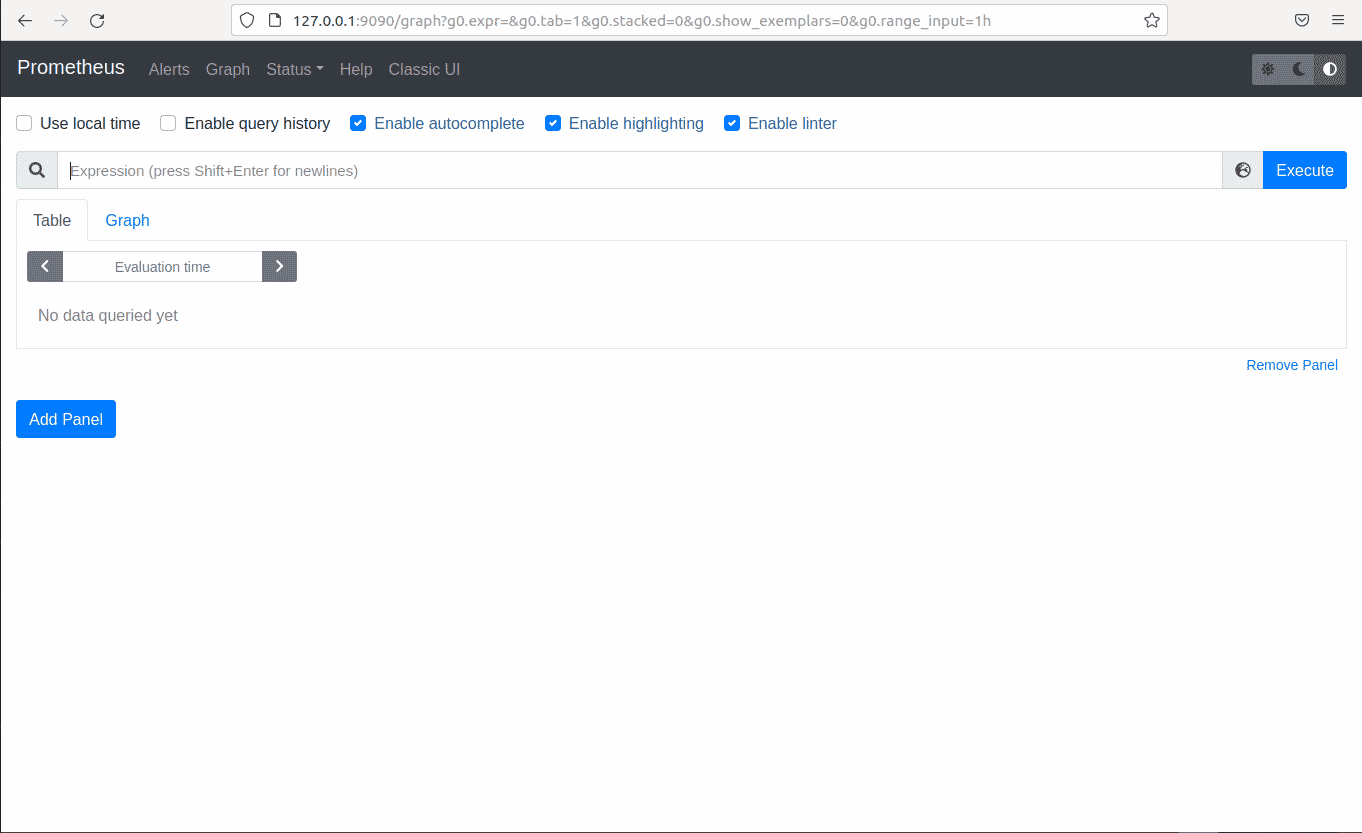
Open a web browser and access Prometheus as shown below:
$ http://server-IP:9090.
You will see the following screen.
Prometheus is now running on Ubuntu 20.04 system. You can now start monitoring your system performance and metrics.

Karim Buzdar holds a degree in telecommunication engineering and holds several sysadmin certifications including CCNA RS, SCP, and ACE. As an IT engineer and technical author, he writes for various websites.