
Written in Go and Typescript, Grafana is an opensource monitoring & alerting tool that is widely used by companies for monitoring, data visualization, and analytics . It provides highly customizable and feature-rich dashboards which can be configured to visualize data from a wide range of data sources. Grafana can be integrated with popular tools such as InfluxDB, Graphite and Prometheus to enhance monitoring and visualization of metrics.
In this instructional guide, we will walk you through installing Grafana on Rocky Linux.
Step 1: Add Grafana repository on Rocky Linux
To get started, we will add the Grafana repository on our local system to take advantage of updates as they are rolled out. Therefore, create a repository file as shown.
$ sudo vim /etc/yum.repos.d/grafana.repo
Next, paste the entire code provided below on the file and save the changes.
[grafana]

name=grafana

baseurl=https://packages.grafana.com/oss/rpm

repo_gpgcheck=1

enabled=1

gpgcheck=1

gpgkey=https://packages.grafana.com/gpg.key

sslverify=1

sslcacert=/etc/pki/tls/certs/ca-bundle.crt
Next, update your Rocky Linux repositories to sync with the newly added Grafana repository.
$ sudo dnf update
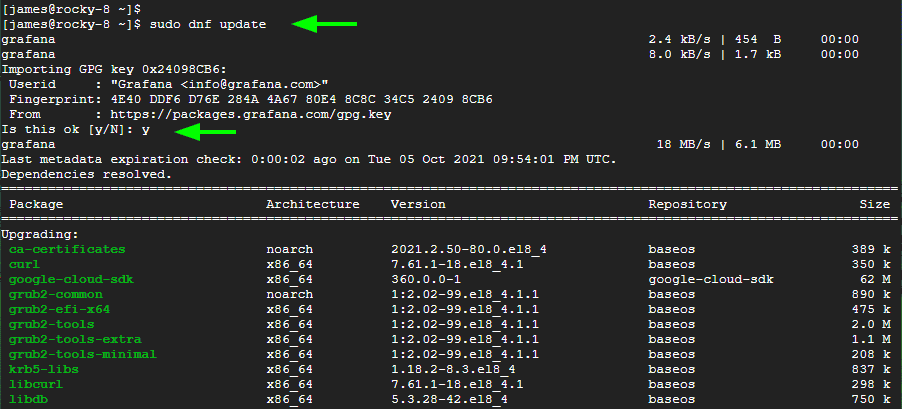
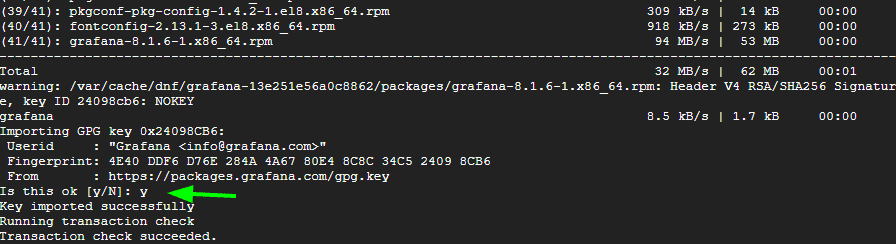
Along the way, you will be prompted to import the GPG key. Simply type ‘y’ and hit ENTER to proceed with importing the key.
Step 2: Install Grafana on Rocky Linux
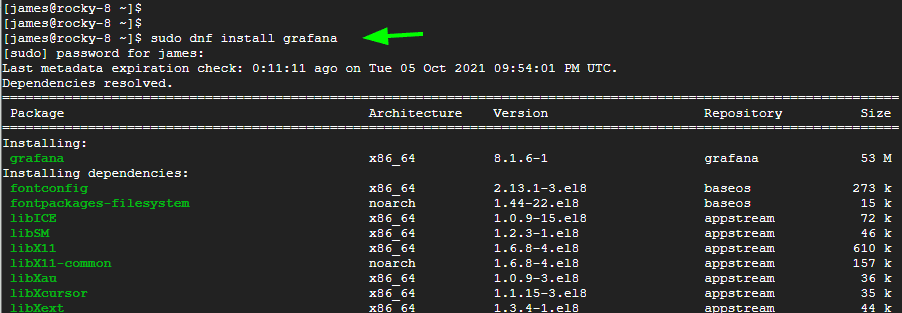
Once the Grafana repository is added, the only thing remaining is to use the DNF package manager to install Grafana. Therefore, invoke the command:
$ sudo dnf install grafana
The command installs Grafana alongside a host of other dependencies.
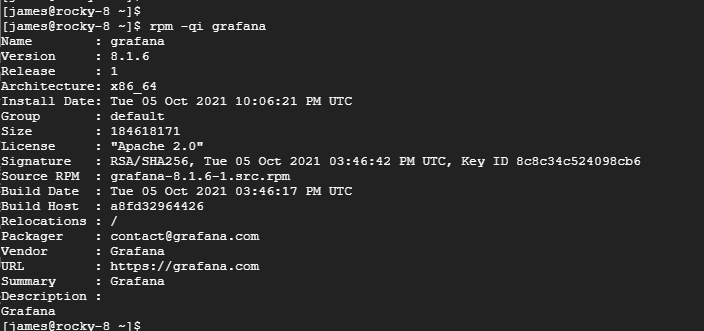
You can probe the details of the version of Grafana installed using the command provided
$ rpm -qi
This prints out details of Grafana such as the name, version, release number and installation date to mention just a few of the details.
Step 3: Start and Enable Grafana
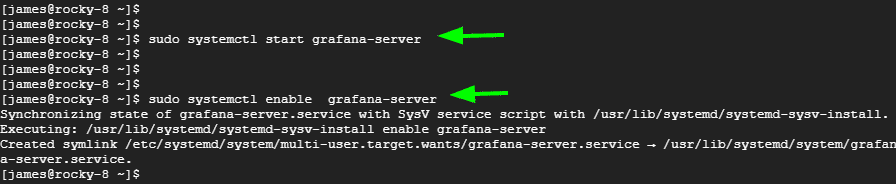
The Grafana service is, by default, inactive upon installation. We need to get it up and running using the command:
$ sudo systemctl start grafana-server
To enable Grafana server so that it comes on automatically on boot or upon a reboot, invoke the command:
$ sudo systemctl enable grafana-server
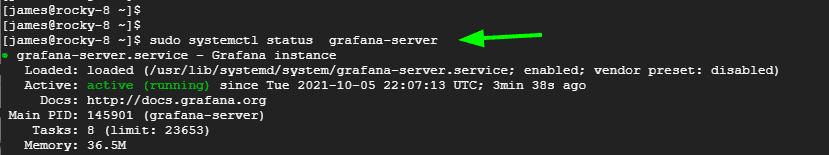
Just to be sure that Grafana is running, execute the command:
$ sudo systemctl status grafana-server
Step 4: Configure Firewall
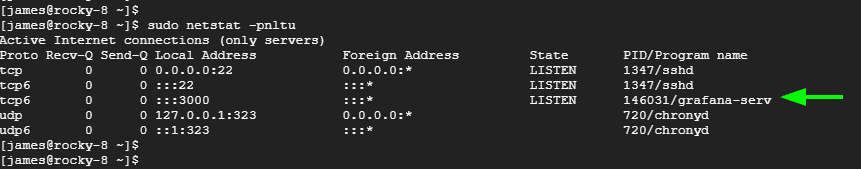
To access the Grafana GUI monitoring dashboard, we need to go an extra step and allow port 3000 on the firewall. This is the port that Grafana listens on by default. You can use the netstat command to verify this as shown.
$ sudo netstat -pnltu
Therefore, run the following commands to allow the port across the firewall.
$ sudo firewall-cmd --add-port=3000/tcp --permanent
$ sudo firewall-cmd --reload
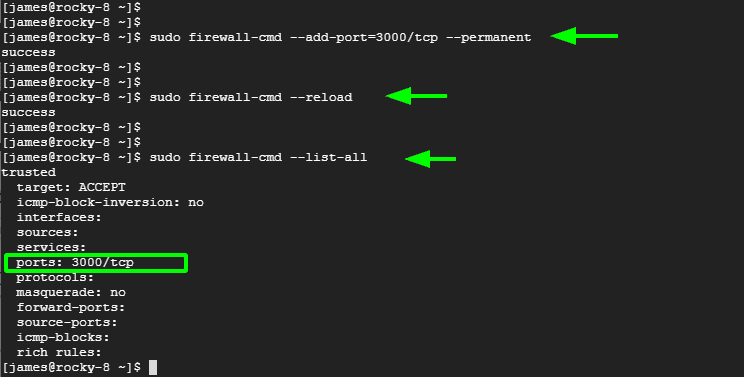
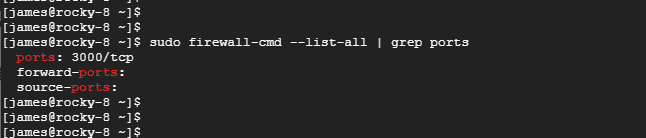
To verify that the port has been allowed on the firewall, run the command:
$ sudo firewall-cmd --list-all | grep ports
Step 5: Access Grafana dashboard
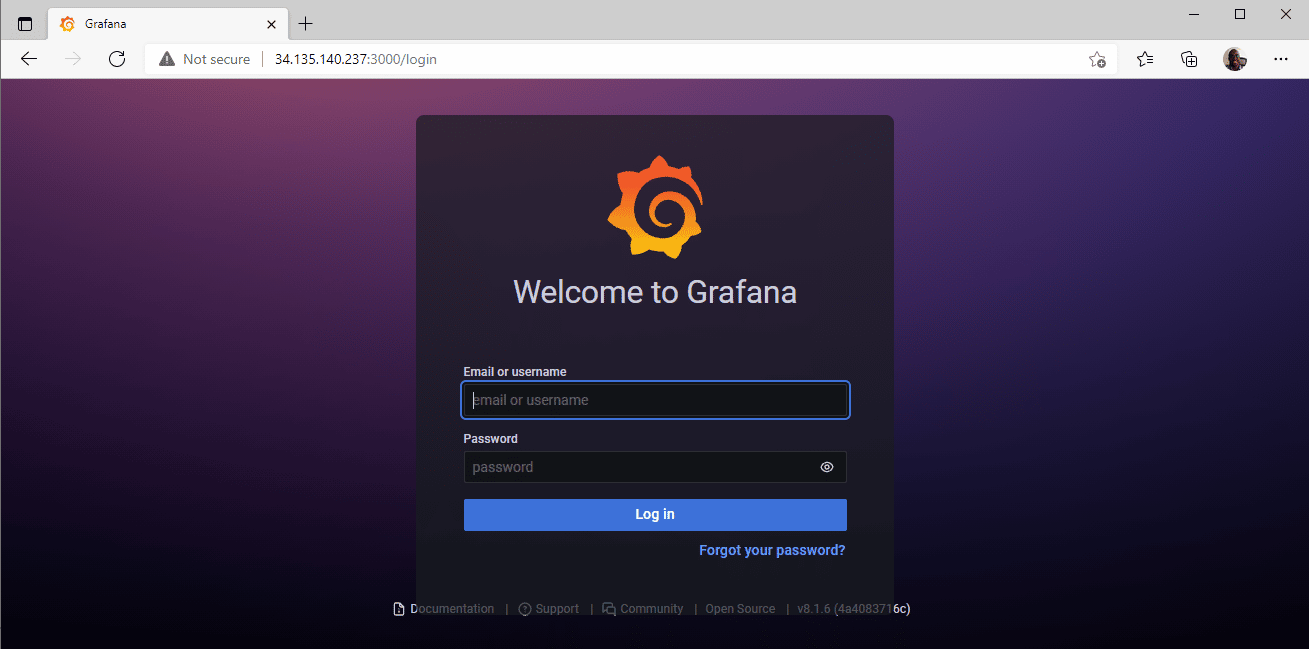
After all is said and done, the final task is to login to the Grafana dashboard. So launch your browser and browser the URL:
http://server-ip:3000
You will be redirected to the Grafana login page shown. The default credentials are
Email / Username: Admin
Password: Admin
For security purposes, you will be required to reset the password and provide a stronger password to prevent possible breaches.
Finally, you will be ushered to the Grafana dashboard as shown.
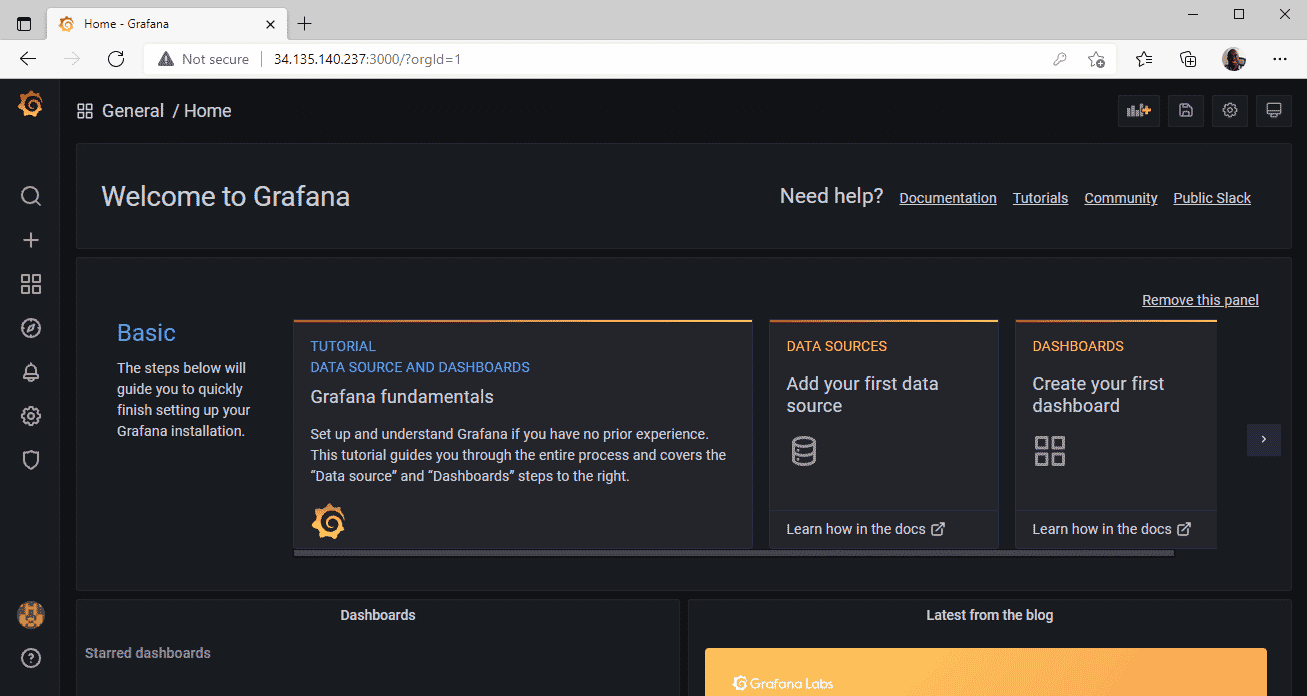
From here, you can add data sources from a myriad of environments and start monitoring your applications. It’s our sincere hope that you can now install Grafana on Rocky Linux 8.

Karim Buzdar holds a degree in telecommunication engineering and holds several sysadmin certifications including CCNA RS, SCP, and ACE. As an IT engineer and technical author, he writes for various websites.